View the tentative white paper here: https://docs.google.com/document/d/1SNGPiXUhtpM14wsuH2g4CMaPnX8PJAeJI8bSigpDG-w/edit?usp=sharing
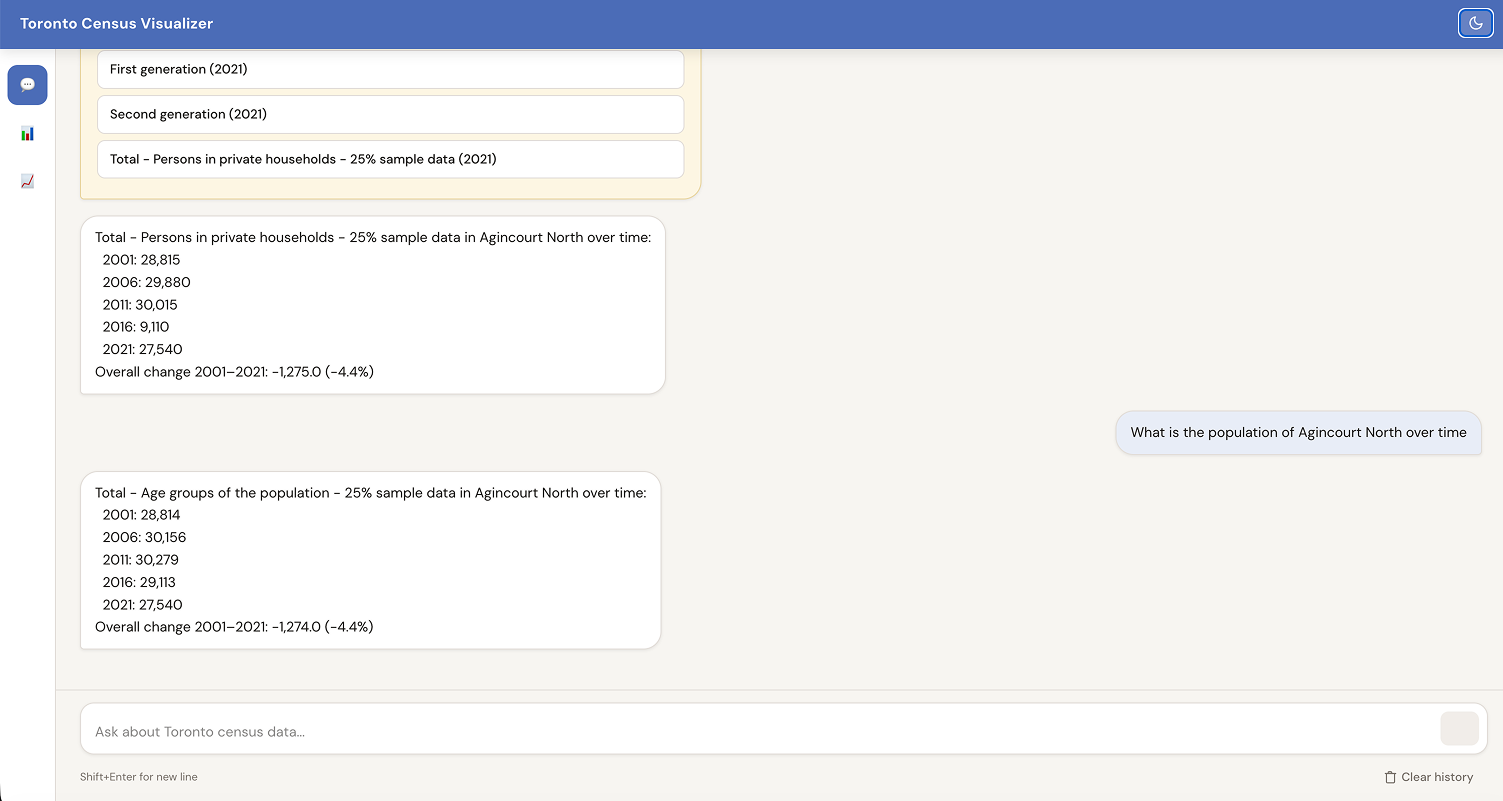
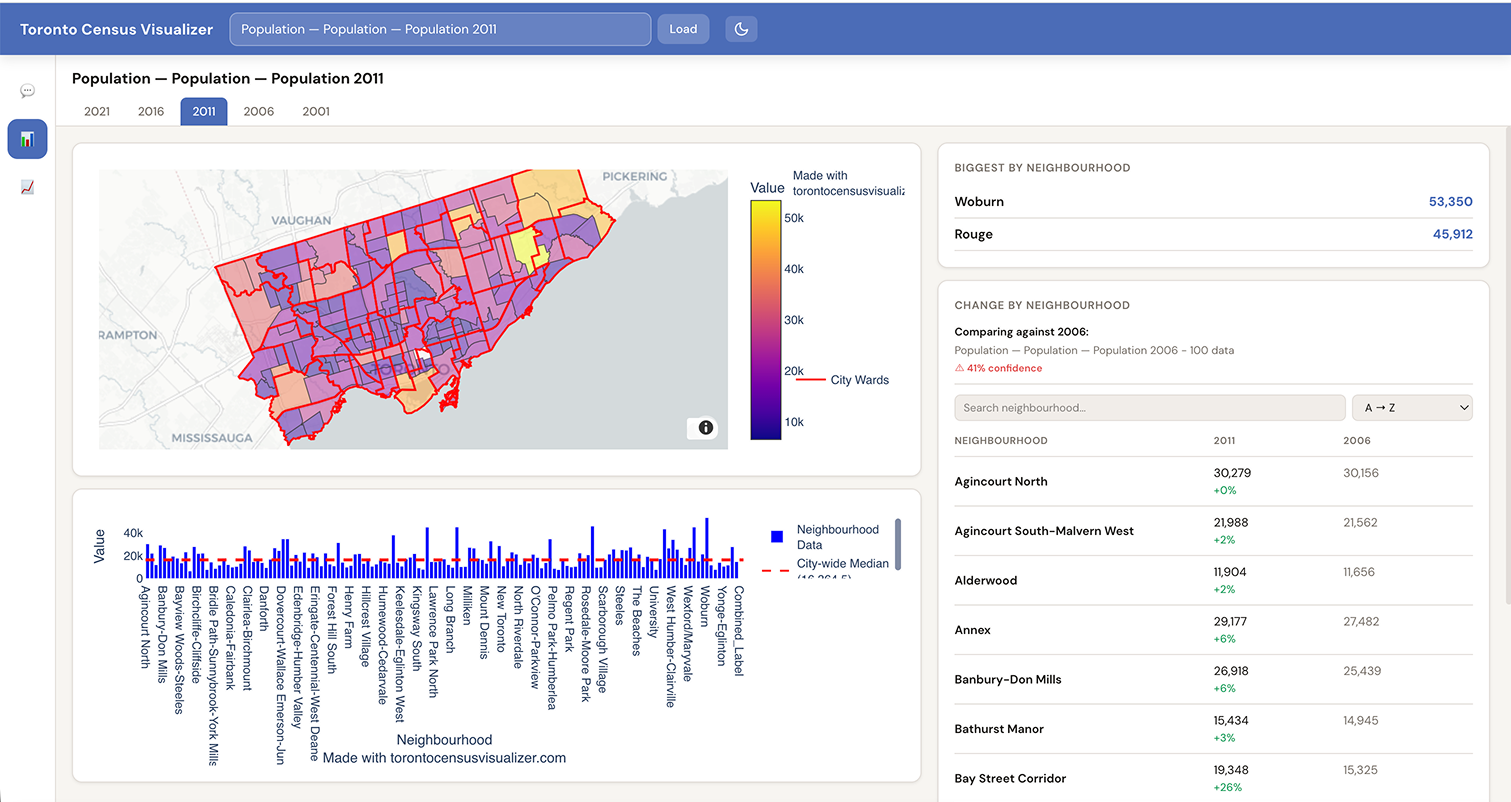
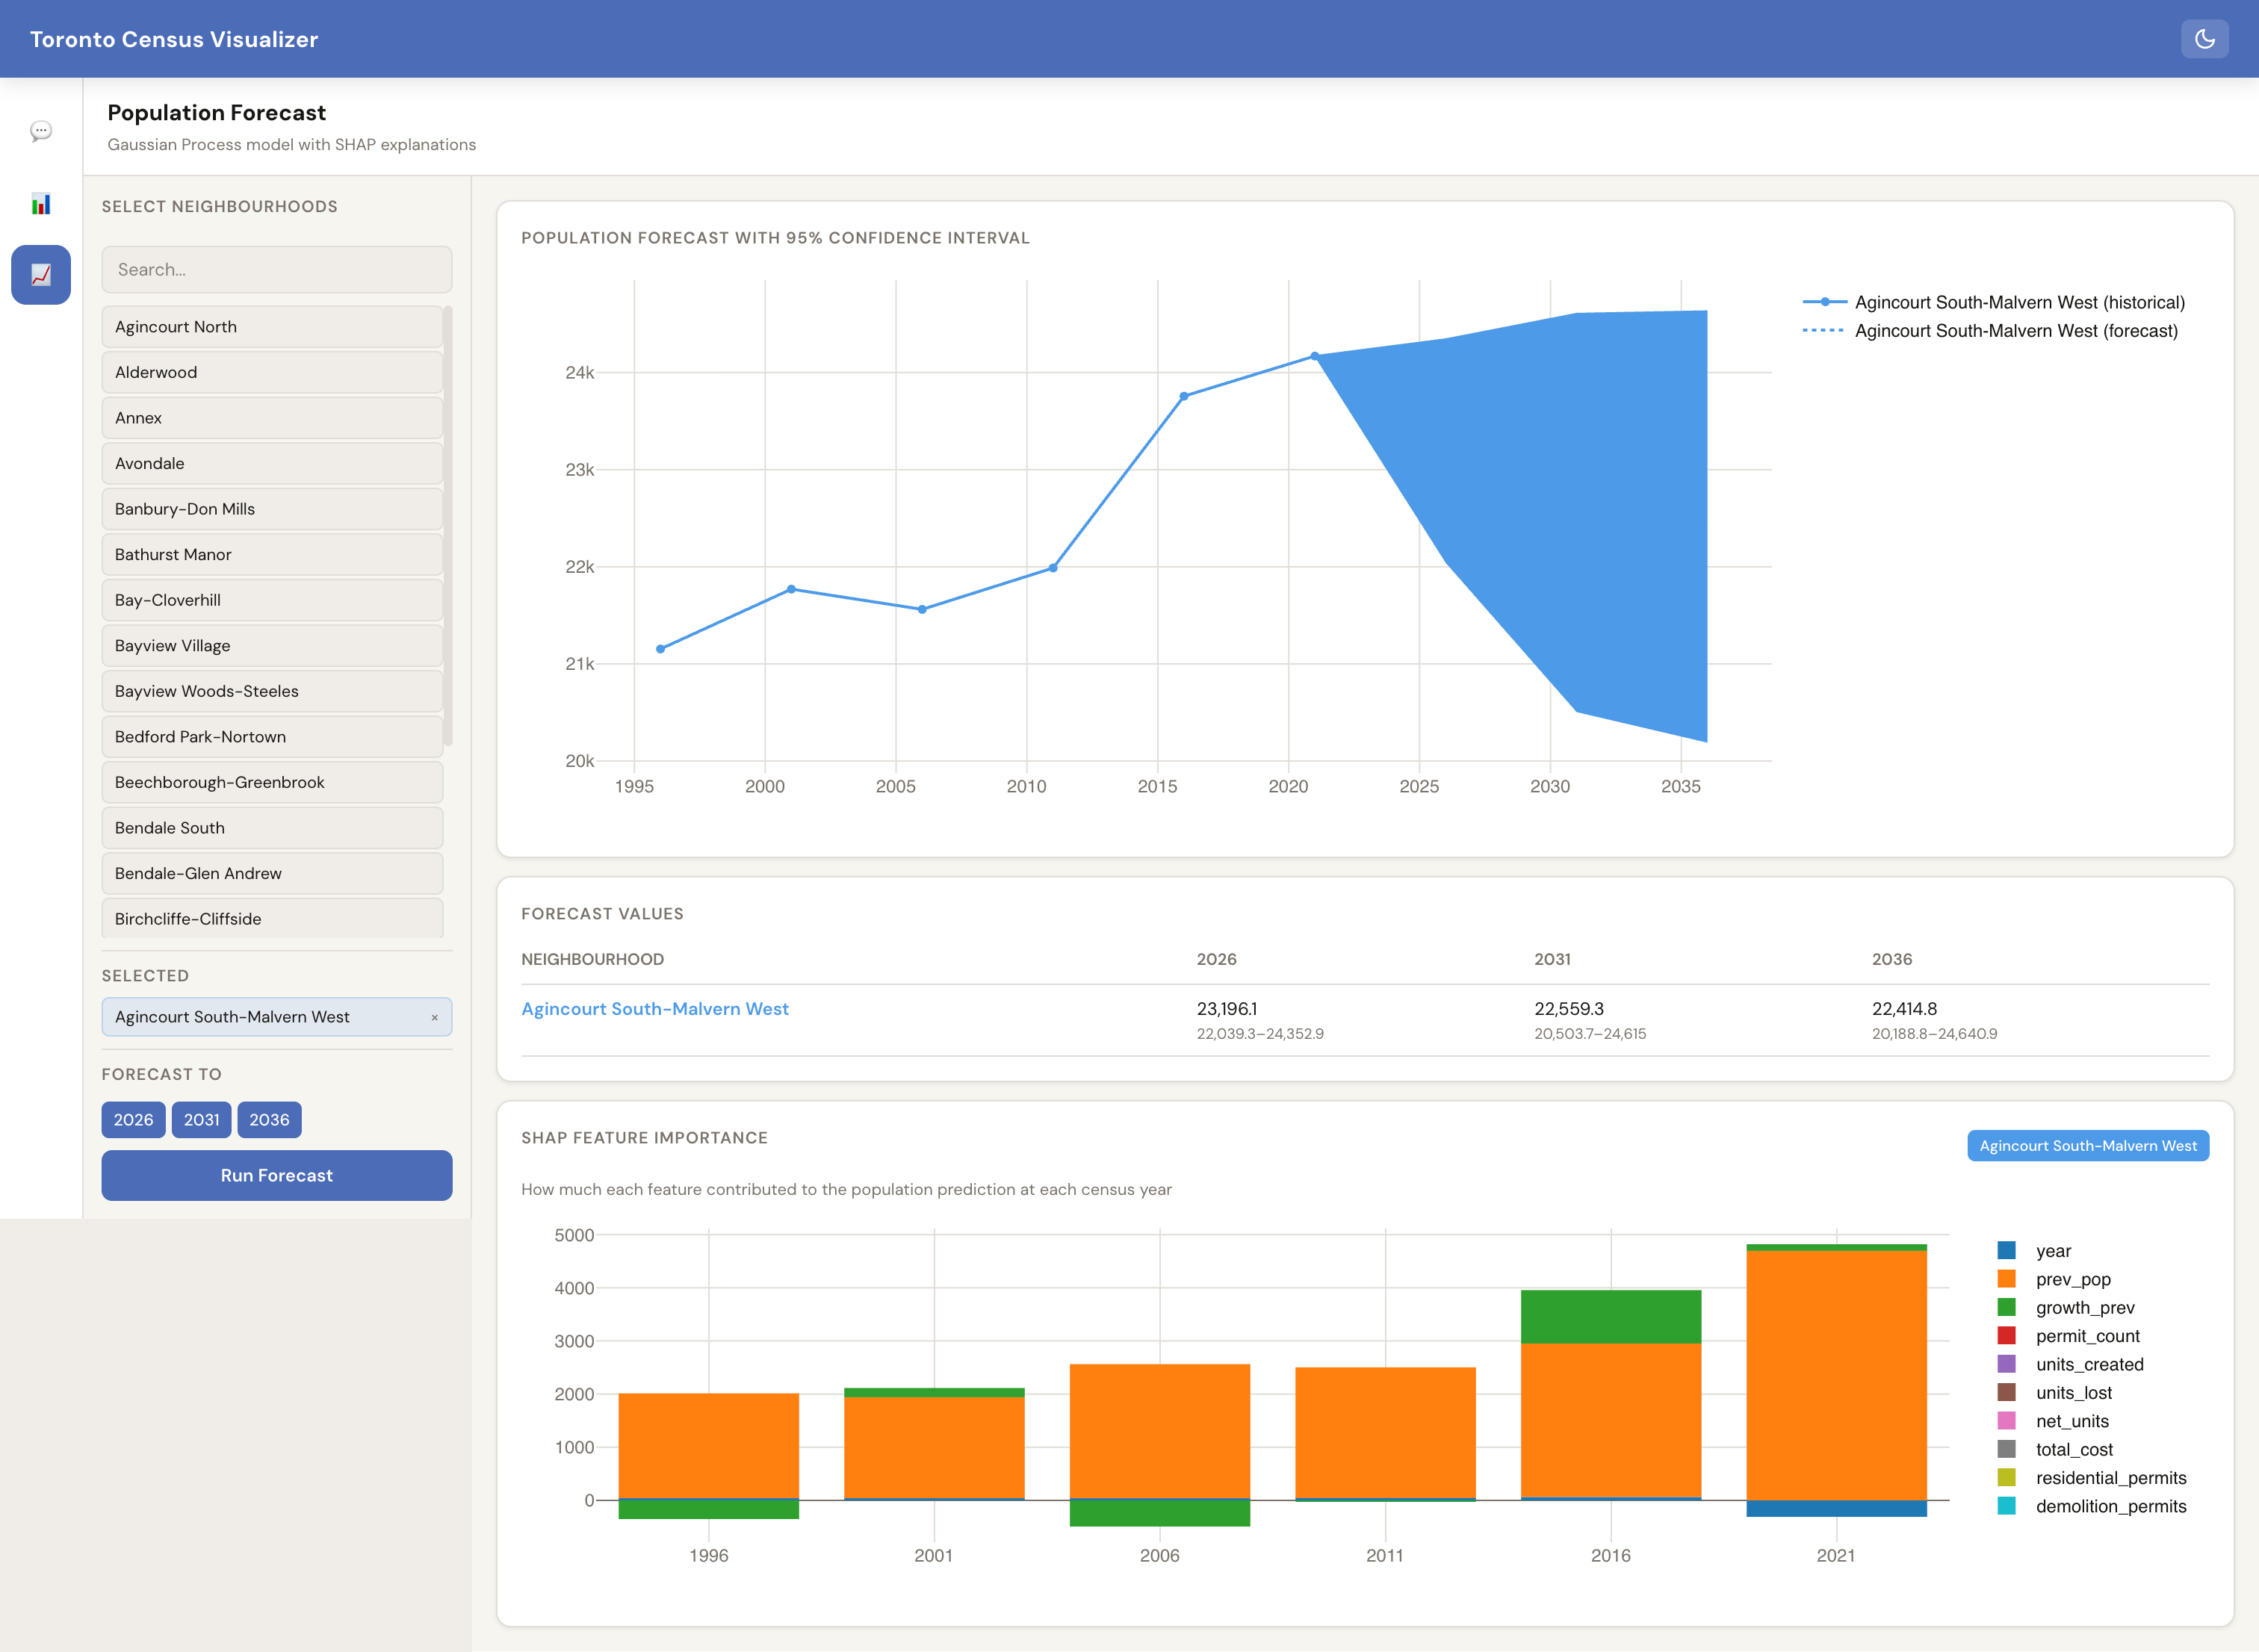
A website to parse natural language questions about Toronto Census data (2001–2021) and return structured answers, maps, and statistical charts.
The system uses a combination of deep learning (transformer-based named entity recongition/intent classification) and a RAG (vector search) to break down census queries easier.
The project follows a pipeline to process a query:
- Parse (
query_parser.py): Uses a PyTorch model to identify the intent (ranking, comparison, trend), the census metric, and entities (neighbourhood names, years). - Retrieve (
rag.py): Performs a vector search via ChromaDB to find the census row ID corresponding to the user's requested metric. - Fetch (
ask.py/data_loader.py): Fetches it from the CSV.data/weights/140_to_158.parquetis used to convert it appx. from the old 140 to the newer 158 neighbourhood model - Visualize/Respond (
api.py): Generates a human-readable text response or exports data as Plotly charts and PDF maps
Requests are managed from Python -> Go -> TypeScript
Input Question:
"How did the average household income change in Malvern between 2016 and 2021?"
System Flow:
- Parser detects: Intent =
compare_years, Neighbourhood =Malvern, Years =[2016, 2021]. - RAG finds the row ID for "Average household total income".
- Ask fetches values for those years and calculates the difference.
- API returns a JSON response with a human-readable text answer.